
Getting your inventories in shape - a guide for CFO's
What impact would a 25% reduction in inventory have on your business? Well:
- It would make a nice difference to your balance sheet. It would reduce working capital and overall capital employed. It would reduce the amount written off for obsolescence each year
- It would make a nice difference to your income statement. Typically inventory holding costs (including finance costs) can add up to 25% of the value of inventory held each year
- You would have some cash available for more interesting uses than sitting in a warehouse: capital investment, acquisitions or equity buy-back for instance
- And it would make a nice difference to the ratios your investors care about. Both Return on capital employed and return on equity will improve, as will Earnings per share (EPS), especially if you choose to use the liberated cash for a share buyback
Suggesting an improvement in working capital to most CFO’s is a case of preaching to the choir. To illustrate the impact of a 25% reduction in inventory on key financials we have included an example in an appendix to this paper. For a €2.5bn turnover company with €400m in inventory such as the one we take in our example it improves ROCE by 2%, EPS by 3% and ROE by over 4%. These percentages will heavily depend on your circumstances; the point is that the difference is enough to care about.
The case for holding inventory
There cannot be too many CFO’s who wouldn’t sign up for the scale of improvement above if they believed it was achievable. But is less inventory automatically a good thing? Well not if it is at the expense of customer service or sales. The whole purpose of inventory after all is to provide a buffer between demand and your ability to supply. If profit margins are high, and raw materials markets unpredictable, the temptation to hold plenty of inventory can be strong. But our contention is that most firms have significantly more than they need, whilst still managing to run short of some items.
A hundred years ago, inventory was considered a good thing. The attitude was “pile them high, sell them cheap”. Assets were a source of pride. But increasingly, leanness is considered a virtue. In times of seemingly constant innovation and change, the risk of obsolescence is high and almost all products can seem ephemeral. Increases in on-demand production and the ease of finding alternatives via online services is only intensifying this trend. Online retailers can actually achieve negative working capital. Whilst this isn’t the case in most other industries, we do see that the ability to be agile and to hold inventories much closer to ideal levels is increasingly going to be a source of competitive advantage.
To get a very approximate sense of how close to the mark you are, look at your Days Inventory Outstanding (DIO). This measure takes your total inventory value and divides it by cost of sales days (total cost of sales/365). The number you get will not tell you very much per se – different businesses will have significantly different inventory needs – but comparison with your peers should be informative, and the figure will give you the ability to sense check it yourself. If your DIO is equivalent to 80 days, for instance, as in the simplified example in the appendix below, that means on average you are holding over 2.6 months of stock. Does it take you that long to source, produce and ship your products, even allowing some spare for demand fluctuation? It might do, if you have long lead times, a lengthy production process and high demand variability, but these are the types of question to ask your Operations teams. Bear in mind as well that with an average of 2.6 months of stock, you will have significantly more of some items. Reducing DIO to 60 days, again following our example, still gives you 2 months’ inventory on average.
This is one of the headaches for a finance executive. Supply chains are different. Depending on your production strategy (make to order vs make to stock), the seasonality and variability of your demand, the lead times in your supply chains and the economics of your target service levels, the “right” amount of inventory for you can vary enormously. Appropriate policies will also vary depending on your industry and the nature of your supply chain.
Plus there are of course other levers to improve working capital, which may well seem much simpler to pull. Reducing accounts receivable is mostly about internal process discipline. Even increasing accounts payable, whilst often labour intensive, is usually just a case of lengthening payment terms with your suppliers. And increasingly, supply chain financing options exist to help improve this balance depending on your own particular working capital needs. By comparison, inventory can seem a very complex undertaking, and one which we know many firms have tried and failed to address in the past.
Between having an intuition that you might be holding excess inventory and actually being able to see exactly what you should have, let alone do something about it, there is quite a gap. Indeed, we find that between firms who have tried and failed to seriously get a handle on inventory and those who have consistently put off doing something about it, there are very few who have tight control of inventories and a strong understanding of the different levers which contribute to it. But why is this so?
In our experience, at the heart of the problem lies data. A reasonably large firm might easily have thousands of different items between finished goods, work in progress and raw materials. Each transaction should be captured in your ERP systems, and stocks should be reconciled with physical stocks at least once per year. With this data, you have everything you need to analyse your inventory and identify optimal levels BUT the data is hard to extract, manipulate and then calculate, whilst inventory optimization software, whether built into your ERP or integrated with it, is highly sensitive to relatively minor input adjustments which are frequently poorly understood. As a result, even mathematically sound planning tools fail to do the job of optimizing inventory and don’t really give you any insight into how you are performing overall and what can be done to improve the situation.
From a lack of clear and accessible data stems a number of other challenges: inability to correctly identify the root causes of sub-optimal stock levels, and a politicisation of inventory. In the absence of good data there are many competing voices with different agendas and no obvious objective mechanism to decide between them. Other KPI’s, which should be balanced through inventory management, are given priority: Supply Chain focus on On Time In Full (OTIF) deliveries, whilst Sales provide inflated forecasts because they are measured on total sales not forecast accuracy. Unions like inventory as it reduces pressure on workers. All of these factors will tend towards excessive stock being accumulated.
Cutting through the data complexity
How nice it would be to have the following picture available for every item you stock, as well as a roll-up of overall optimization potential:

A = actual historical stock on hand. B = average of A. C = target stock on hand. D = average of C. E = excessive stock, or difference between actuals and target.
This graph shows a familiar basic supply chain concept. The blue “sawtooth” line (C) represents what you should have had on stock. The green line floating above it (A) represents what you actually had. Fairly simple to plot a course of action from this picture.
Of course, the simplified model upon which this diagram is based needs to be enhanced with probabilistic considerations to account for all kinds of variability. You also need to understand demand patterns, which is a science in itself. This raises the bar somewhat on the mathematical front. It also demands segmentation along ABCXYZ lines to identify appropriate policies for different types of stock. But with this type of granularity you have a perfect springboard to drive root cause analysis item by item.
We meet many executives who understand the principles at play here, but precious few who have access to the ability to extract large volumes of data (many millions of transactions) and perform the appropriate mathematical analysis on them. We have personal experience of consultants being brought in to do the heavy lifting. A team can be buried away for 2 to 3 months crunching the numbers, which drives cost and is highly prone to human error. Or high-level assumptions are made to avoid going into this level of detail, but then the business case is less robust and the roadmap of what to attack is less clear and usually focuses on macro-processes such as planning and forecasting. Consultant-led projects normally do succeed in taking out inventory in the short term – if nothing else the executive focus their presence guarantees will deliver this – but it is less clear that this benefit is sustainable, and this engenders reluctance to try this route again.
We also find that inventory optimization software has a tendency not to deliver on its promise. Whilst the better of these tools are built on similar mathematical principles to the more basic of our own tools, they are mostly focused on deriving target inventory levels and they are highly sensitive to inaccuracies in input data such as lead times or demand forecasts. We find many instances where companies are simply overwriting the targets generated by the software since this is an easier fix than understanding and addressing the underlying issues. It is easy to spend a lot of money on inventory optimization software without getting much value from it.
What we have done at nVentic is to automate the data analytics required to truly understand what’s going wrong in your inventory. What others will take weeks if not months to do, we can do in a matter of hours or days. But we are not selling software. We find that a rather high level of expertise is needed to understand how inventory optimization software really works, and we find it more beneficial to our customers to provide them with the outputs of the analysis rather than the tools themselves. Plus our customers don’t need to train people or buy a licence for an analysis they only need to carry out once or twice a year.
In addition, we firmly believe that the only way firms will develop sustainably optimized inventories is by building capability in their internal teams. Our preferred way of working is therefore to partner with a client team to deliver change. nVentic provides the analytics and the expertise, and we help guide your team through a process of understanding the root causes and addressing them over a period of months and in some cases years. For if the truth be told, we know that many companies out there, particularly in the manufacturing sector, have the potential to reduce inventories by much more than 25% whilst actually improving service levels. Getting there is likely to take more than one year though – your teams need to learn to walk before they can run, and whilst you most likely already have a number of strong inventory people, they need to be able to bring the rest of the organization with them. 25% is typically a reasonable target for year 1 however.
Is it time for you to get your inventories in shape?
For more information about nVentic, please see our website www.nventic.com or contact us for an initial discussion: information@nventic.com
Appendix
Illustration of the impact of a reduction in inventory on key financials*
(All of the figures in this very simplified example are set out below and on the next page.)
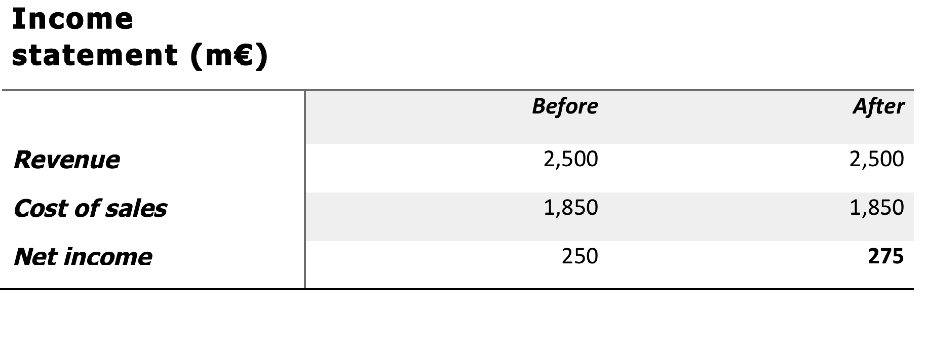
Let’s say your business turns over €2.5bn each year, with cost of sales of €1.85bn and net income of €250m. On the balance sheet you have €400m inventory, €600m in receivables and €700m in cash. In addition, you have non-current assets of €1.2bn, giving total assets of €2.9bn. On the liabilities side you have €900m in current liabilities and €800m in non-current liabilities. With €1.7bn liabilities you therefore have €1.2bn in equity.
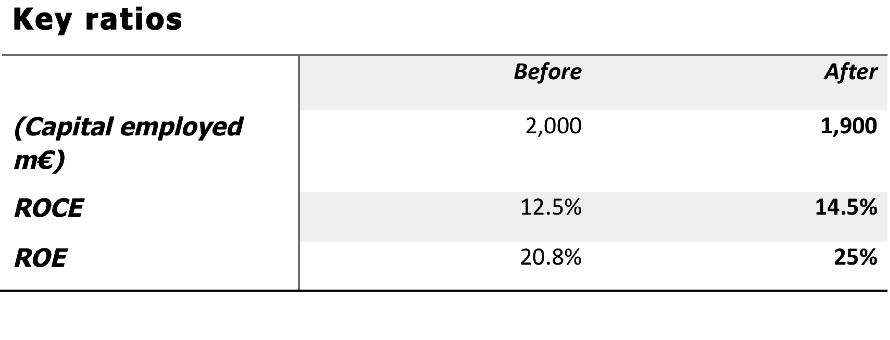
Your capital employed is €2bn. Using this highly simplified model, you therefore have ROCE of 12.5% and ROE of 20.8%.
Let’s say you reduce your inventory from €400m to €300m, a 25% reduction. Since studies have shown the holding costs of inventory to be approximately 25% of the value of inventory each year, you will at least in theory increase net income by €25m. (In fact, the P&L impact will almost certainly be less than this, since holding costs include both variable and fixed costs, and absorption can be a challenge, especially in the first year of a programme, but for simplicity here we will use the full 25%. See also our article on holding costs.) Your ROCE will thus improve to 13.8% and your ROE to 22.9%. If you just transform the reduced inventory into cash you will not have affected your net working capital overall, although your acid-test ratio will have improved. You will also most likely need to write down less inventory at the end of the year. Maybe an improvement from €20m to €15m written down. But with the example we have taken, liquidity ratios are not a concern and cash reserves are generous. More likely that with a return on equity of 20%+ there is a strong case for further investment or a share buyback to boost earnings per share (EPS). If price per share is €20 and there were 150m shares on average to begin with, 5m shares could be bought back and earnings per share increase from 1.833 to 1.896, an improvement of nearly 3.5%.
We can summarize the numbers as follows (assuming the share buyback):
Let’s say your business turns over €2.5bn each year, with cost of sales of €1.85bn and net income of €250m. On the balance sheet you have €400m inventory, €600m in receivables and €700m in cash. In addition, you have non-current assets of €1.2bn, giving total assets of €2.9bn. On the liabilities side you have €900m in current liabilities and €800m in non-current liabilities. With €1.7bn liabilities you therefore have €1.2bn in equity.
Your capital employed is €2bn. Using this highly simplified model, you therefore have ROCE of 12.5% and ROE of 20.8%.
Let’s say you reduce your inventory from €400m to €300m, a 25% reduction. Since studies have shown the holding costs of inventory to be approximately 25% of the value of inventory each year, you will at least in theory increase net income by €25m. (In fact, the P&L impact will almost certainly be less than this, since holding costs include both variable and fixed costs, and absorption can be a challenge, especially in the first year of a programme, but for simplicity here we will use the full 25%. See also our article on holding costs.) Your ROCE will thus improve to 13.8% and your ROE to 22.9%. If you just transform the reduced inventory into cash you will not have affected your net working capital overall, although your acid-test ratio will have improved. You will also most likely need to write down less inventory at the end of the year. Maybe an improvement from €20m to €15m written down. But with the example we have taken, liquidity ratios are not a concern and cash reserves are generous. More likely that with a return on equity of 20%+ there is a strong case for further investment or a share buyback to boost earnings per share (EPS). If price per share is €20 and there were 150m shares on average to begin with, 5m shares could be bought back and earnings per share increase from 1.833 to 1.896, an improvement of nearly 3.5%.
We can summarize the numbers as follows (assuming the share buyback):
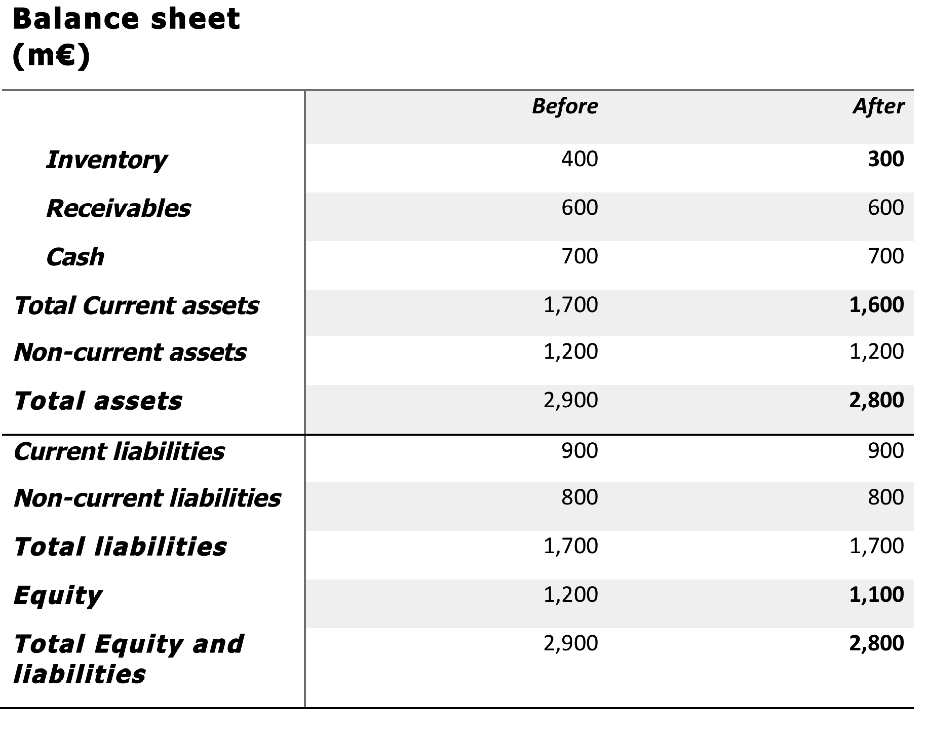
* The “Before” figures for this illustration are all taken (approximately) from a real company, the one major change we made being to reduce their actual starting inventory from ~€700m to €400m.
Would you like to receive more content like this, direct to your inbox? We publish white papers on a range of supply chain topics approximately once every one to two months. Subscribe below and we will notify you of new content. Unsubscribe at any time.
Would you like to talk to one of our experts? Contact us