Inside This Report:
- Gain insight on the 3-year trend (2022-2024) driving aggressive vs. controlled inventory strategies in Big Pharma.
- Benchmark your company’s performance against a newly segmented list of top-tier and high-DIO peers.
- Understand why industry capital tie-up is at “near-unprecedented” levels (and who is most exposed).

Insight
nVentic surveyed 250 C-suite executives at large European manufacturers at the end of 2023 on their perceptions of inventories.

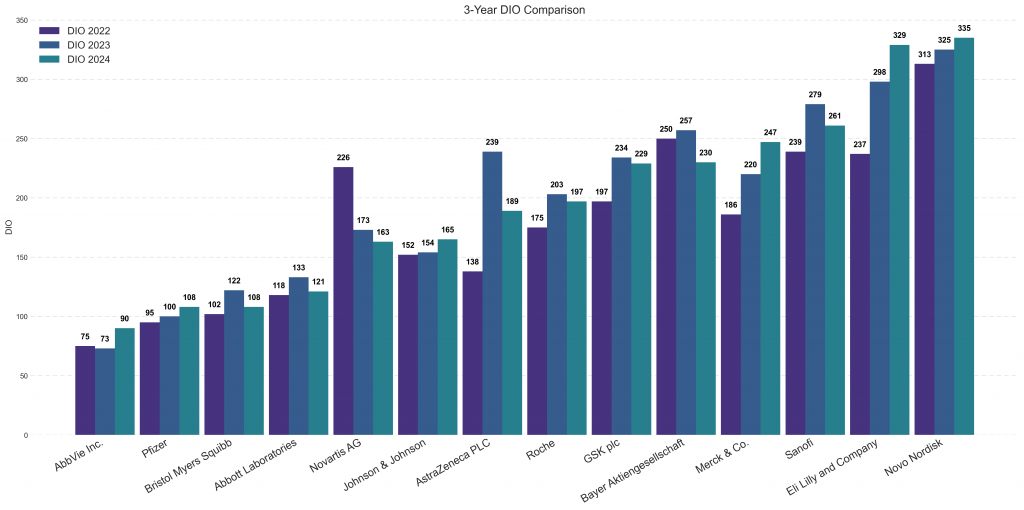
The period spanning 2022 through 2024 reveals a sustained upward trend in Days Inventory Outstanding (DIO) across the global pharmaceutical industry.
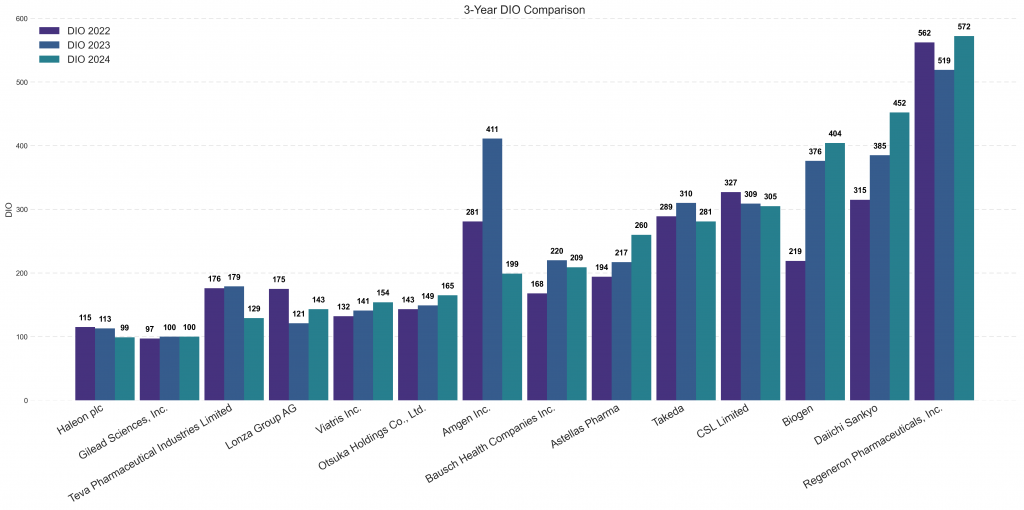
This inventory expansion is particularly pronounced among the group of companies with historically higher DIO, and some firms have recorded extreme spikes in stock levels, leading to near-unprecedented capital tie-up.
Conversely, the largest turnover companies showed more modest, though still persistent, growth in DIO. Segmentation by size displays the necessity of a closer, peer-group-specific evaluation to understand the operational trade-offs being made across the sector.
Days Inventory Outstanding (DIO) = inventory value/(cost of sales/365).
2025 Report Methodology Update
As of the 2025 publication, we have implemented several changes to the public-facing report methodology to enhance accessibility and relevance:
- Categorization by Turnover: The benchmark is now split into two distinct categories based on annual turnover to facilitate a more meaningful comparison.
- Data Sources: Our analysis begins with publicly available financial data without requiring costly subscription services. Data was sourced from annual reports for ten companies where publicly available ticker data showed significant deviation, ensuring accuracy where necessary.
- Exclusion of Private Companies: Their exclusions means Boehringer Ingelheim is no longer in the report.
- Content Focus: To keep the report focused on financial efficiency, we have opted not to include the analysis of inventory write-offs and the impact of new product launches (new medicines) in this version. This information is readily available through Large Language Models (LLMs) and can be detailed further in our bespoke client reports.
Trends
The three-year comparison demonstrates that the industry’s inventory build-up is far from over, as the majority of benchmarked companies registered a net increase in DIO between 2022 and 2024. For most firms, the 2024 figure is visibly higher than that of 2022. While valid reasons for carrying high inventory exist, such as ensuring security of supply, meeting regulatory requirements, and managing long lead times, the nature of the increases suggests two distinct phenomena: a controlled, strategic expansion in the largest companies, and more aggressive stock building among other groups.
This aggressive approach was most dramatic in the group of companies with generally higher DIO. Biogen, for instance, saw its DIO nearly double, increasing by an astonishing 185 days from 219 to 404. Similarly, Daiichi Sankyo registered a substantial increase of 90 days, moving from 362 to 452, representing some of the most aggressive stock building in the benchmark. This sustained growth was also visible among the top-tier players. Eli Lilly, for example, saw a major DIO climb of 90 days, rising from 237 to 329, which indicates a significant strategic focus on maintaining supply ahead of projected blockbuster demand.
However, not all companies followed this expansionist trend. Regeneron remains a significant outlier in the sector, with its DIO reaching a high of 572 days in 2024, far exceeding all peer averages; this figure highlights the importance of its specific strategies regarding R&D capitalization and long-term pipeline management. On the other end of the spectrum, a handful of companies maintained tight control. AbbVie remained relatively stable around the 90-day mark, and Gilead finished the period with a lean DIO of 97 days, both reflecting effective inventory management. CSL also successfully contracted its inventory in a challenging environment, seeing a reduction from 327 days to 305 days.
The Path to Optimization
While this public report provides a high-level view of industry performance and systemic trends, we recognize that optimization requires data far more granular than public financial filings can provide. Sustainable competitive advantage and efficient capital management depend on deep, peer-group-specific operational analysis.
Our detailed client reports provide a much deeper perspective, moving beyond the standard trends to offer an extended development analysis. This compares the evolution of inventory, Cost of Sales, Revenue, and absolute inventory value changes over a full six-year period, rather than just three. The reports also quantify the scale of the opportunity by benchmarking performance against Best Demonstrated Practice (BDP) and providing a determined estimate of the working capital potential available through optimization.
To understand the drivers, we include a detailed inventory breakdown, offering a multi-year comparison of all components, including Finished Goods, Work-in-Progress (WIP), and Raw Materials. This analysis is complemented by a full breakdown of allowances and write-offs, identifying where value is being lost and how management practices can be improved.
Upon client request, we also have the capacity to expand the scope to analyse inventory both upstream and downstream, leveraging dedicated partnership-building efforts and client-held third-party data sources (such as IQVIA, Nielsen, or GfK market intelligence) where appropriate.
We recognize that benchmarks are merely indicators. By coupling the comparative data with a full nVentic evaluation, we build the crucial bridge between benchmarks and operational reality, allowing us to see what is truly happening at the SKU (Stock Keeping Unit) level.
If you have any questions about this report, or would like help improving your organisations’s inventory levels (whether you feature in the benchmark or not), please contact us.
nVentic helped a manufacturer identify double-digit improvements. We also quantified the impact of existing constraints through process industry inventory optimization.
Context
Our client was a manufacturer of high-quality material solutions in a very competitive market. To deal with their competitive landscape, they had successfully driven down production unit costs. However, their production schedule was constantly running at or near capacity. This created a surplus of inventory. Challenges with service level had only recently been addressed to bring them close to target.
Production and supply planning were done manually. Important ERP fields such as lead time and Minimum Order Quantity (MOQ) were left blank. This was a barrier to automation. Because the most important raw materials were chemicals, the system used backflushing to record raw material consumption based on the bill of materials. This is a classic challenge in process industry inventory optimization.
Approach
nVentic’s standard Inventory Evaluation faced a number of challenges due to the data. Backflushing was causing significant negative balances in WIP but as the overall value was low, we decided to exclude it. We worked with local planning teams to derive good, conservative estimates for lead times as well as the MOQ’s actually in use, which were very significant. These data inputs were collated with other master data and all transactional data directly from the ERP. Service levels were set very high to account for late delivery penalties agreed with customers.
Because the MOQ’s were very high compared to average demand, nVentic also carried out sensitivity analysis to quantify the impact of those MOQ’s on inventory levels precisely. This then allowed our client to reassess their production constraints in light of the impact on working capital.
Results
nVentic’s Evaluation, even with the full constraints applied, identified a reduction potential of over 20% while improving service levels fully to their target levels. Moreover, our sensitivity analysis demonstrated that the MOQ’s applied by Production to maximise their output KPI’s more than doubled the overall inventory requirements. Reducing batch sizes allowed more products to be manufactured each week. This reduced inventory requirements while improving responsiveness to changes in demand.
Our work in master data also allowed bulk uploads of validated critical data to the ERP, which allowed the client to move towards a digital transformation in planning technology
When British mathematician and computer scientist Clive Humby coined the expression “data is the new oil” in 2006, he was making a point not just about the value of data, but also about the need to refine, distil and make by-products from it to make it useful to drive business innovation.1 While Professor Humby’s primary focus has been consumer data, his observations are equally true of enterprise data.
Major enterprises generate no small amount of data. And within that data resides key information to allow you to optimize your inventories. But what does that end-to-end data analytics process look like? And how can organisations improve it to further optimize their inventories?
Step 1: refining inventory analytics data
A major weakness in the relevant data sets for inventory analytics is their format and their accuracy. The data you need is usually deep within Enterprise Resource Planning (ERP) systems or similar. This means that it is already challenging to extract the data in a format conducive to analytics. A surprising number of organisations consider even getting good visibility of what inventory they have a victory. Furthermore, data accuracy problems within those data sets are legion. Here are some of the most common causes of data inaccuracy concerned:
- Transactional data is subject to booking errors, especially in non-discrete manufacturing but also elsewhere
- The relevant master data structures can be complex and misunderstood. To take just one example, there are often multiple lead time fields in ERP, with limited documentation as to what each should contain, leading to incorrect and inconsistent use
- Many master data fields require manual input, leading to errors, gaps and data that is no longer up to date
- Some master data field values are subject to considerable variation
When you consider that for a large enterprise you may be dealing with millions of transactions and hundreds or thousands of items, getting your data into sufficient shape is a daunting task in itself. Where data is contained within an enclosed system, such as a warehouse management system, it is possible, using technology like RFiD, to build and maintain very accurate data sets that then enable all kinds of optimizations. Unfortunately, when it comes to the wider supply chain this is not the case. Too many of the critical data points for inventory optimization rely on externalities for you to simply use raw ERP data without significant curation.
Step 2: distilling inventory analytics data
Let us imagine that you have a perfectly refined data set. Now you need to distil it in a way that will allow you to analyse your inventories. Here we can differentiate between descriptive and prescriptive inventory analytics (what inventory you have and what inventory you should have). Descriptive inventory analytics requires minimal statistical analysis. It provides basic inventory visibility and classification, breaking inventory down by type and over time. This might include things like aging stock reports, ABCXYZ analysis, and so on. It is a very useful overview, but doesn’t tell you how close to optimal your inventories are.
In order to progress into prescriptive inventory analytics, you need to calculate what an optimal level would be. Here, you have a choice between an approach that primarily uses inventory science (equations) and an approach that primarily uses modelling by way of simulations. In principle, it should be possible to achieve the same results with either approach, however modelling is significantly more time- and power-hungry than an equation-based approach. Modelling is particularly useful when you don’t know what precisely what you’re looking for. Equations are much more efficient when you do know precisely what you’re looking for.
With either approach, the chief challenge is the multiple variables and sensitivities involved in an optimization calculation. Especially if you’re dealing with a complex operation with many different types of products and processes, one-size fits all is highly unlikely to give you equally accurate or useful target inventory values for everything. While it may seem that modelling is free from some of the complexities of equations, in reality each model is highly dependent on the starting parameters you feed it and experimenting with different values is again extremely time consuming. Usually only the model builder themselves understands the model well.
Step 3: making inventory analytics by-products
Before undertaking the first two steps, you should ideally have a clear idea of what you are working towards. Ultimately, the questions most people are trying to answer about their inventories, are:
- How much do I really need?
- What should I do differently?
Statistical analysis is a great way of answering the first question and a vital step in answering the second. We are going to look at the second question in Step 4 (driving business innovation), but in the design of our inventory analytics by-product we should ensure that it answers the first question well and that it does so in a way that makes it useful for the next step.
Working out how much inventory you need comes down to either modelling or calculating the minimum inventory you need to hit target service levels. But when you have done this, how do you know if you’ve got it right? The first option is to put blind trust in your analysis. A preferable option is to test the conclusions of your analysis. However, this runs into a number of practical challenges, the first of which is change. Inventories and the variables that influence them are constantly changing. By the time you have tested your analytics and discovered problems, it is difficult to ascertain whether your issue is change or your analysis itself.
In reality, single value answers are of limited value. Instead, good inventory analytics should measure a whole range of properties for every single item to allow multiple segmentations. There is also a balance to find between precision and utility. There is almost no end to the number of adjustments you could make to an optimization calculation based on different properties of each item. But your analysis then becomes much more difficult to understand and is liable to fail at the next step. On the other hand, oversimplify your model and your analysis will only be valid for a subsection of your inventory.
For the by-product of your inventory analytics to be valuable it must find the right balance between precision and utility. It must also be:
- Built using sufficiently refined data (see step 1)
- Distilled using an appropriately robust process (see step 2)
- Rigorously tested to ensure validity
- Be sufficiently scalable and automated that it can be refreshed frequently and easily for all of your inventories
It takes significant time and multiple iterations to create a by-product that is genuinely fit for purpose. Avoid manual processes or over-reliance on individuals otherwise your accuracy and sustainability are heavily compromised.
Step 4: driving business innovation through inventory analytics
Inventory analytics is ultimately only useful if it allows you to better optimize your inventories. Too many organizations put a lot of effort into analysing their inventories but then stumble at the final stage of getting operations to take advantage of the analysis. Why is this final step so difficult?
The simple answer is complexity and change. There are many different factors that affect your inventory levels and the gap between actual and optimal inventories. Let us explore some of the major ones:
- A mismatch between how optimization calculations are derived and how planning is done on the ground. A good optimization calculation will factor in variability in quite a different way to how human brains normally do it and quite likely in a different way to any planning tools or methods that you might be using. An optimization calculation will take all available data and work out the very best levels. Most planning processes, on the other hand, look primarily at the forecast and then factor in some kind of safety stock based on expected variability. However, the planning process does not necessarily use the same statistics or assumptions as the optimization calculations. This means it can be very difficult to understand what needs to change to achieve optimal levels
- In the planning process, change is constant. Planners spend a lot of time dealing with changes in demand, in production schedules and in expected deliveries. Today’s inventories are normally the result of decisions taken weeks if not months ago. Untangling everything that has changed in the intervening time is not only laborious and difficult, but sometimes simply impossible if forecasts and schedules are constantly overwritten. This can lead organisations (often wrongly) to assume that forecast accuracy is their only or biggest issue: “we must have expected we’d need this”
- Over-reliance on systems, tools and models within the planning process. Companies spend a lot of money on technology that promises to optimize inventory. But, even if the technology itself is fit for purpose, if the data within it, its parameter settings, or simply the way it is being used are not correct then it will not properly help to optimize your inventories. An assumption that the technology is right, however, leads to complacency. Where it disagrees with your inventory analytics, it is extremely difficult to understand what is driving the difference
- Insufficiently refined raw data. However smart your analytics is, if your raw data is not sufficiently refined then it will produce results that your planning team know to be wrong, destroying confidence in the whole of the analysis
- Organisational and behavioural constraints. Sometimes inventories are sub-optimal because of conflicting incentives elsewhere in the organisation (for example, production trying to maximise output) or because planners are unwilling to ignore forecasts they know from experience to be wrong. This type of effect is highly prevalent but invisible in inventory analytics other than the results.
So what is the solution? How can organisations better use inventory analytics to deliver sustainable improvements to their inventory levels? For now, let’s assume that you have got a perfect by-product, with perfectly refined data and an optimally distilled analysis.
The first use of good inventory analytics is in reactive measures. Whether or not you understand the root causes of your inventory imbalances, you can at least see and address them. This might mean postponing or cancelling orders or production. This is often the method companies choose when they have a temporary or cyclical drive to reduce inventories. Depending on your starting position and lead times, it can be possible to reduce inventory by 10% in just a few months while improving or maintaining service levels.
Such a rapid improvement in your cash position is significant and very valuable. However, it doesn’t deliver sustainable inventory performance if done as a one-off exercise. Many inventory reduction programmes are successful in the short term only for inventory levels to rise again after the focus comes off. One way to avoid this is simply to keep iterating the process. Analyse your inventories twice a year or once a quarter and continue making reactive adjustments. If your inventory analytics can be done quickly, accurately and at scale across your business at a reasonable cost, this is not a bad solution. At nVentic, we have developed such a solution, which we call the Inventory Evaluation.
Ideally, rather than postponing or cancelling unnecessary orders, you would avoid raising them in the first place. To do this, you need to align the cadence of your analytics with your planning cycles such that your planners have useful decision support. But in this case, you need to turn your analytics around very quickly and present it to planners in a very simple format. Again, nVentic has developed a solution for this too which we call the Inventory Projector.
However, good inventory analytics allows you to go further still by providing insights into the root causes of inventory imbalances. If your planning processes and parameters were optimised in the first place then you wouldn’t need so much reactive work. Here we need to differentiate between insights that you can glean directly from your analytics and insights that you can only develop by considering your processes in parallel. To take an example as seemingly simple as safety stock, the optimal amount will vary depending not just on the distribution of your demand (which your analytics should tell you) and on your lead time (the accuracy of which you can only ascertain with further effort) but also on the planning approach you follow. If you plan deterministically but calculate safety stock using a replenishment model then you won’t have optimal inventory levels.
Conclusions: the limits of inventory analytics and how to get most value from them
In short, the best inventory analytics imaginable will not allow you to sustainably optimise your inventories unless you also put sufficient effort into matching your systems, processes and KPI’s to what the analytics is telling you. Too many organisations have teams of talented analysts producing good analytics that their operations then fail to take advantage of. One solution to this is to use an automated inventory analytics solution like nVentic’s Inventory Evaluation. This allows you to switch your analysts’ focus from producing analytics to interpreting and applying the analytics. Only in this way can you bridge the gap between the analytics and operations.
The other obvious advantages of using a pre-packaged and automated solution like nVentic’s are that it has been rigorously tested with a variety of industries over more than 10 years, separately both measures and mitigates your data quality issues, works directly with raw data from your ERP, uses the best scientific methods and comes with support to help you interpret your data.
A huge amount of improvement is possible with advanced inventory analytics. Our clients regularly see improvements of 20% or more. But the complex nature of supply chain planning for most big organisations means that they need to put much more effort into the interpretation and application of the analytics. Many planning solutions promise inventory optimization but fail to deliver it, not just for some of the reasons outlined above, but also due to the fact that optimization calculations are by their nature too precise when you consider the uncertainties in the underlying data. Humans are still much better at dealing with situations that are unclear.
Progress in big data analytics carries on apace and you should definitely put effort into inventory analytics. But why not change your focus from production to application?
Contact nVentic to discuss how to make a game changing switch to your inventory optimization efforts.