
This is the 2025 edition of nVentic’s Big Pharma inventory benchmark. For the most recent figures, see the 2026 Big Pharma Inventory Trends Benchmark, which covers fiscal years 2023 to 2025.
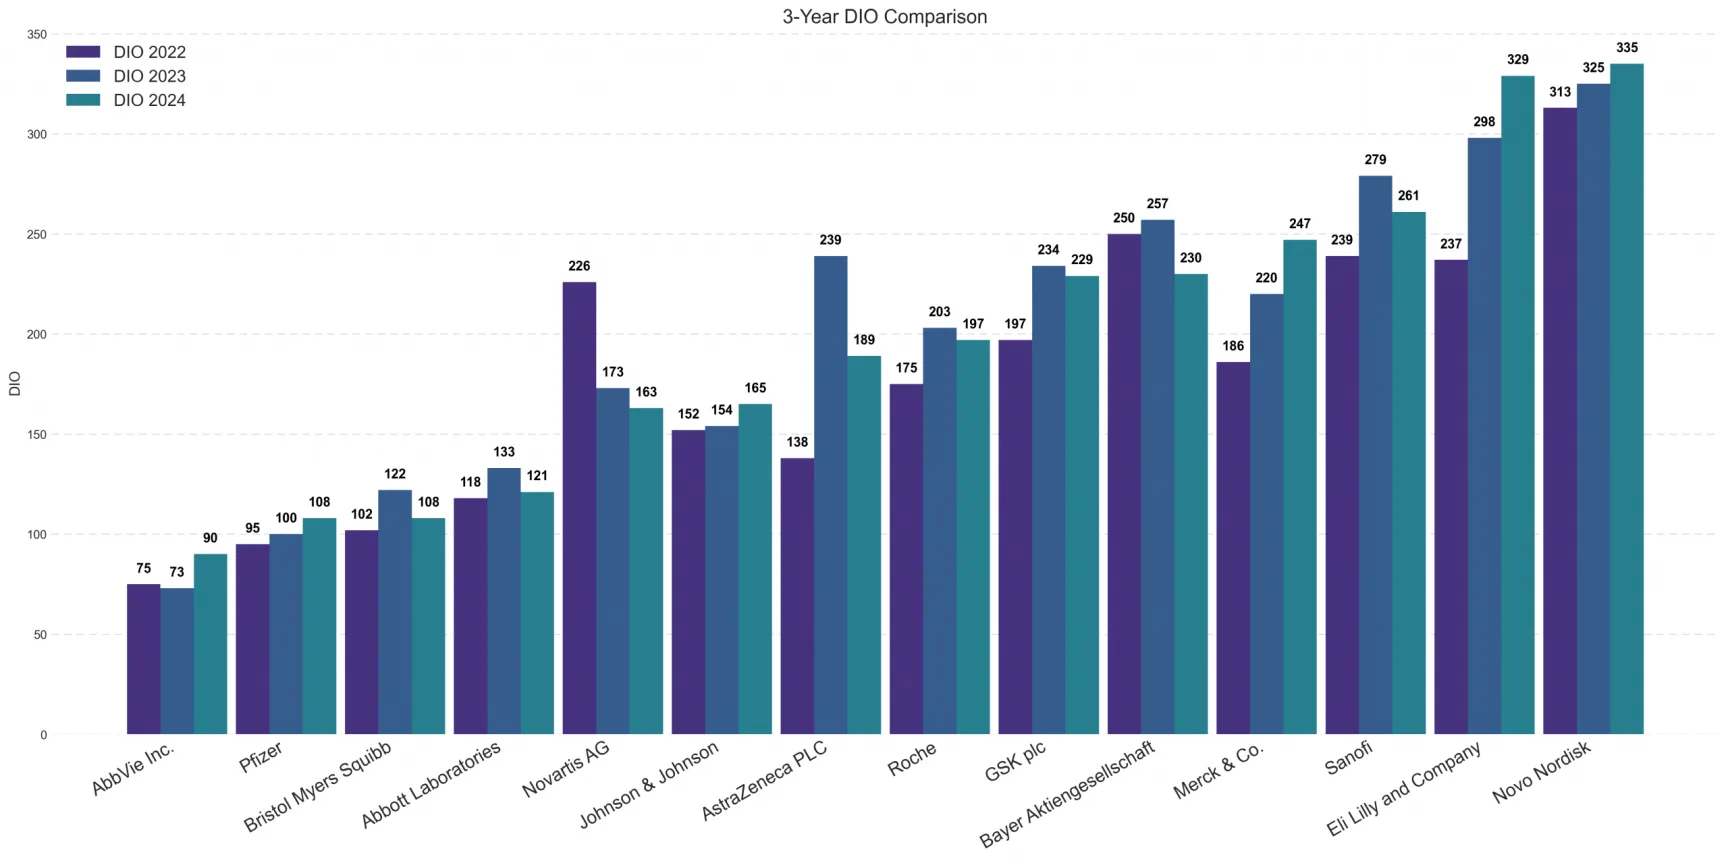
The period spanning 2022 through 2024 reveals a sustained upward trend in Days Inventory Outstanding (DIO) across the global pharmaceutical industry.
This inventory expansion is particularly pronounced among the group of companies with historically higher DIO, and some firms have recorded extreme spikes in stock levels, leading to near-unprecedented capital tie-up.
Conversely, the largest turnover companies showed more modest, though still persistent, growth in DIO. Segmentation by size displays the necessity of a closer, peer-group-specific evaluation to understand the operational trade-offs being made across the sector.
Days Inventory Outstanding (DIO) = inventory value / (cost of sales / 365). The benchmark below covers 28 publicly listed pharmaceutical companies across fiscal years 2022, 2023 and 2024.
2025 report methodology update
As of the 2025 publication, we have implemented several changes to the public-facing report methodology to enhance accessibility and relevance:
- Categorization by turnover. The benchmark is now split into two distinct categories based on annual turnover, to facilitate a more meaningful comparison between peers.
- Data sources. Our analysis begins with publicly available financial data, without requiring costly subscription services. Data was sourced directly from annual reports for ten companies where publicly available ticker data showed significant deviation, ensuring accuracy where necessary.
- Exclusion of private companies. These exclusions mean Boehringer Ingelheim is no longer in the report.
- Content focus. To keep the report focused on financial efficiency, we have opted not to include the analysis of inventory write-offs1 or the impact of new product launches in this version. That information can be detailed further in our bespoke client reports.
Trends
The three-year comparison demonstrates that the industry’s inventory build-up is far from over, as the majority of benchmarked companies registered a net increase in DIO between 2022 and 2024. For most firms, the 2024 figure is visibly higher than that of 2022. While valid reasons for carrying high inventory exist — such as ensuring security of supply, meeting regulatory requirements, and managing long lead times2 — the nature of the increases suggests two distinct phenomena: a controlled, strategic expansion in the largest companies, and more aggressive stock building among other groups.
This aggressive approach was most dramatic in the group of companies with generally higher DIO. Biogen, for instance, saw its DIO nearly double, increasing by an astonishing 185 days from 219 to 404. Similarly, Daiichi Sankyo registered a substantial increase of 137 days, moving from 315 to 452, representing some of the most aggressive stock building in the benchmark. This sustained growth was also visible among the top-tier players. Eli Lilly, for example, saw a major DIO climb of 92 days, rising from 237 to 329, which indicates a significant strategic focus on maintaining supply ahead of projected blockbuster demand.
However, not all companies followed this expansionist trend. Regeneron remains a significant outlier in the sector, with its DIO reaching a high of 572 days in 2024, far exceeding all peer averages; this figure highlights the importance of its specific strategies regarding R&D capitalization and long-term pipeline management. On the other end of the spectrum, a handful of companies maintained tight control. AbbVie held within a narrow 73 to 90 day band and finished 2024 with the lowest DIO in the benchmark, while Gilead stayed close to the 100-day mark throughout, both reflecting effective inventory management. CSL also successfully contracted its inventory in a challenging environment, seeing a reduction from 327 days to 305 days.
Companies with the largest annual turnover
| Company | DIO 2022 | DIO 2023 | DIO 2024 | Change 2022–2024 |
|---|---|---|---|---|
| AbbVie Inc. | 75 | 73 | 90 | +15 |
| Pfizer | 95 | 100 | 108 | +13 |
| Bristol Myers Squibb | 102 | 122 | 108 | +6 |
| Abbott Laboratories | 118 | 133 | 121 | +3 |
| Novartis AG | 226 | 173 | 163 | -63 |
| Johnson & Johnson | 152 | 154 | 165 | +13 |
| AstraZeneca PLC | 138 | 239 | 189 | +51 |
| Roche | 175 | 203 | 197 | +22 |
| GSK plc | 197 | 234 | 229 | +32 |
| Bayer Aktiengesellschaft | 250 | 257 | 230 | -20 |
| Merck & Co. | 186 | 220 | 247 | +61 |
| Sanofi | 239 | 279 | 261 | +22 |
| Eli Lilly and Company | 237 | 298 | 329 | +92 |
| Novo Nordisk | 313 | 325 | 335 | +22 |
Companies with lower annual turnover
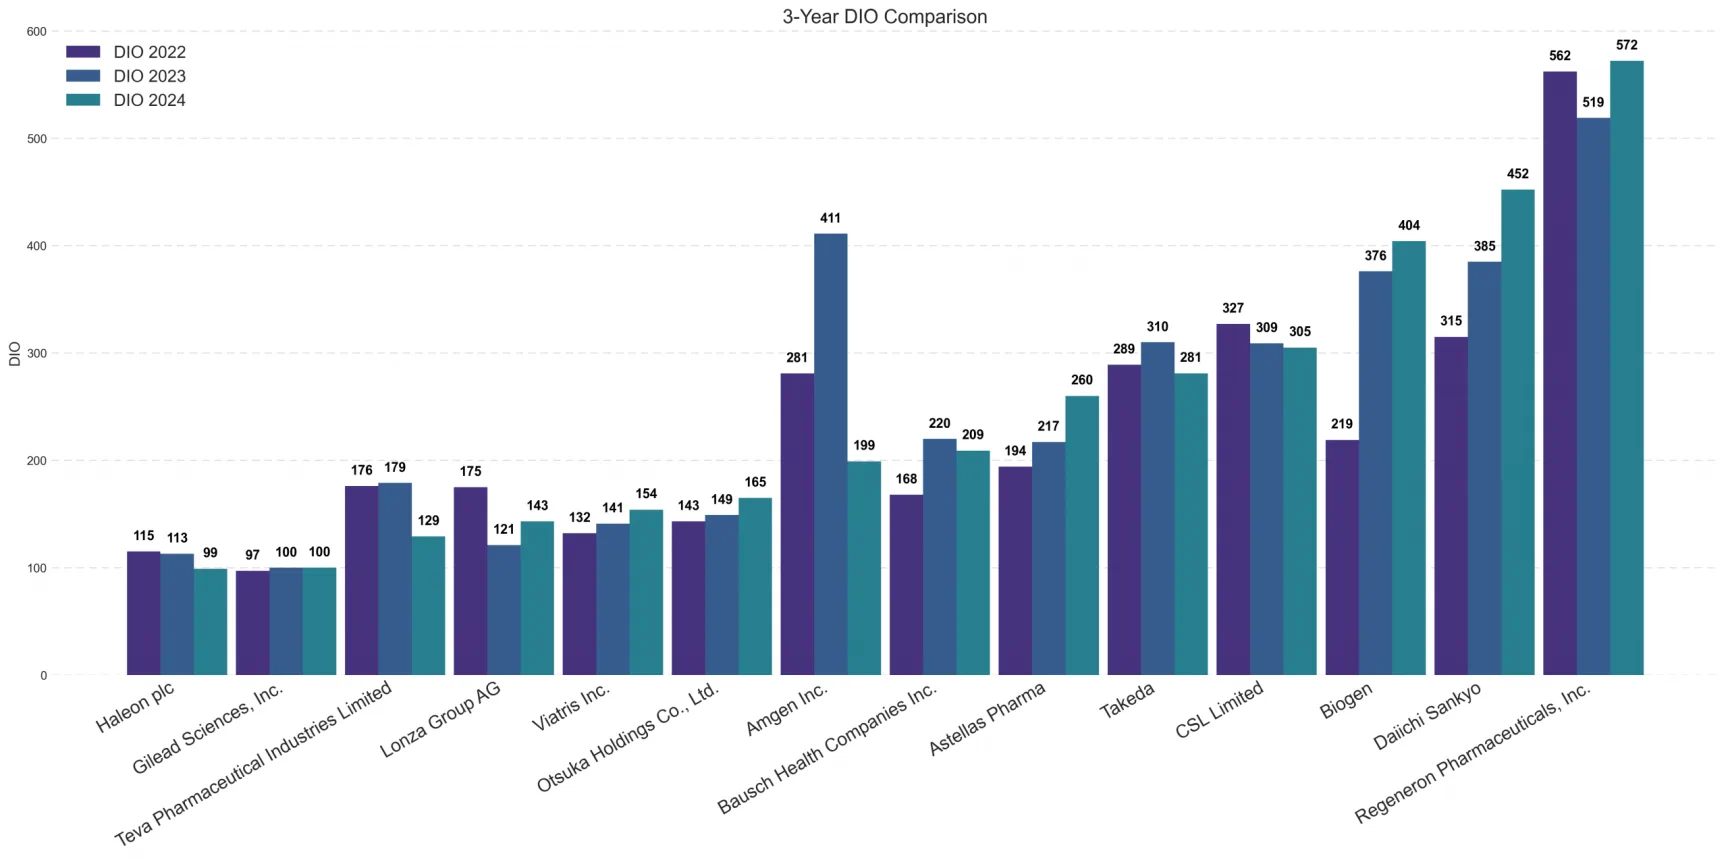
| Company | DIO 2022 | DIO 2023 | DIO 2024 | Change 2022–2024 |
|---|---|---|---|---|
| Haleon plc | 115 | 113 | 99 | -16 |
| Gilead Sciences, Inc. | 97 | 100 | 100 | +3 |
| Teva Pharmaceutical Industries Limited | 176 | 179 | 129 | -47 |
| Lonza Group AG | 175 | 121 | 143 | -32 |
| Viatris Inc. | 132 | 141 | 154 | +22 |
| Otsuka Holdings Co., Ltd. | 143 | 149 | 165 | +22 |
| Amgen Inc. | 281 | 411 | 199 | -82 |
| Bausch Health Companies Inc. | 168 | 220 | 209 | +41 |
| Astellas Pharma | 194 | 217 | 260 | +66 |
| Takeda | 289 | 310 | 281 | -8 |
| CSL Limited | 327 | 309 | 305 | -22 |
| Biogen | 219 | 376 | 404 | +185 |
| Daiichi Sankyo | 315 | 385 | 452 | +137 |
| Regeneron Pharmaceuticals, Inc. | 562 | 519 | 572 | +10 |
The path to optimization
While this public report provides a high-level view of industry performance and systemic trends, we recognize that optimization requires data far more granular than public financial filings can provide. Sustainable competitive advantage and efficient capital management depend on deep, peer-group-specific operational analysis.
Our detailed client reports provide a much deeper perspective, moving beyond the standard trends to offer an extended development analysis. This compares the evolution of inventory, cost of sales, revenue, and absolute inventory value changes over a full six-year period, rather than just three. The reports also quantify the scale of the opportunity by benchmarking performance against Best Demonstrated Practice (BDP) and providing a determined estimate of the working capital potential available through optimization.
To understand the drivers, we include a detailed inventory breakdown, offering a multi-year comparison of all components, including finished goods, work-in-progress (WIP), and raw materials. This analysis is complemented by a full breakdown of allowances and write-offs, identifying where value is being lost and how management practices can be improved.
Upon client request, we also have the capacity to expand the scope to analyse inventory both upstream and downstream, leveraging dedicated partnership-building efforts and client-held third-party data sources (such as IQVIA, Nielsen, or GfK market intelligence) where appropriate.
We recognize that benchmarks are merely indicators. By coupling the comparative data with a full nVentic evaluation, we build the crucial bridge between benchmarks and operational reality, allowing us to see what is truly happening at the SKU (stock keeping unit) level.
If you have any questions about this report, or would like help improving your organisation’s inventory levels — whether you feature in the benchmark or not — please contact us.
Notes
1. For estimates of big pharma inventory write offs, see our article “Inventory write offs in pharmaceutical manufacturing”.
2. For a fuller explanation of how DIO is calculated and what drives it, see our ultimate guide to DIO.